Image by 15548337 from Pixabay
Debugging is the process of finding bugs and/or errors in the program. Debugging in JavaScript can sometimes feel like solving a puzzle, but with the right tools and techniques, you can track and find out the exact cause of the bug. Let’s see how to do debugging in javascript.
Using Sources tab
Every modern web browser has developer tool option which can be accessed using F12 key. In the developer tool, you can see sources tab similar to this:
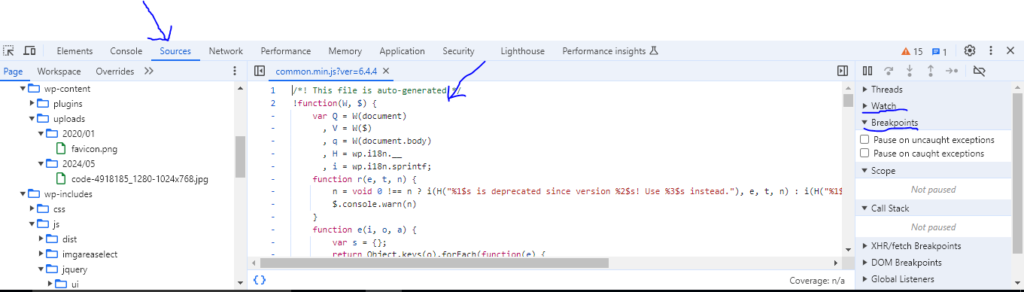
The sources tab has 3 major panels,
- Code Navigator on the very left side which is use to select the file that we want to debug.
- Code editor that will show contents of the selected file from the navigator.
- Some Important tools like Breakpoints, Watch etc (In 3rd section).
Let’s see these tools in details:
Breakpoints
Breakpoints is a specific point in code that will pause the execution of code so that we can examine current state of the variables, code and execute commands in console to debug. We can simply set a breakpoint by clicking on a line number shown in code editor panel(As shown in above image).
You can see list of Breakpoints created under the Breakpoints menu, enable or disable it, or remove it by selecting “Remove Breakpoint” menu after right clicking on breakpoint name.
Watch
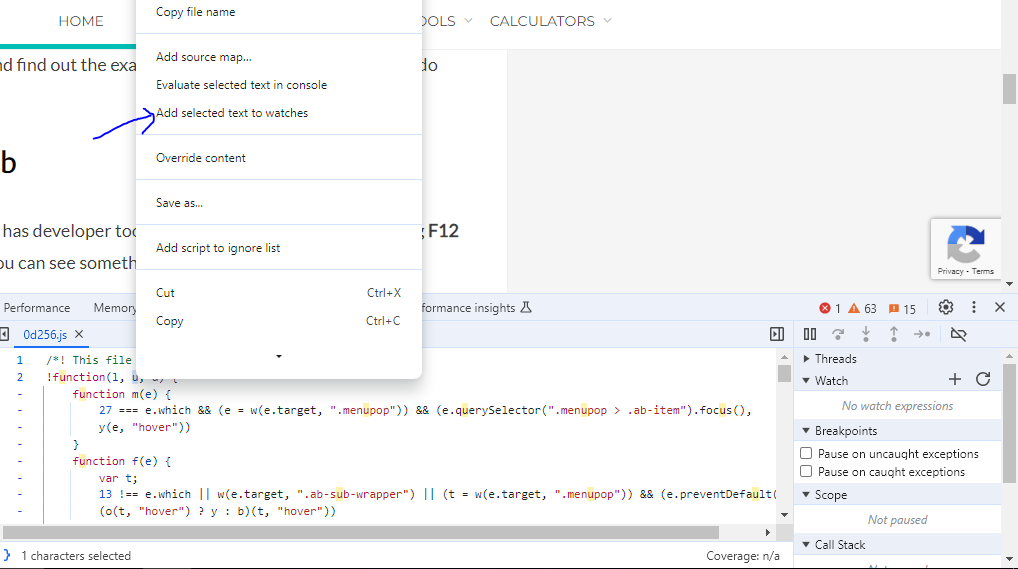
Watch feature allows you to monitor the value of specific variables or expression in real-time while the code is in execution. Watching a variable does not stop the execution like breakpoints. To set a watch on variable, you have 2 options:
- By selecting and right clicking on a variable or expression in code editor panel and then selecting “Add Selected Text to Watches” as shown in below image
2. By clicking on ‘+’ sign and selecting a variable name or expression in text area.
Using a ‘debugger’ command
debugger is a command that we can place inside our code to stop the execution and debug a code. When javascript interpreter encounters a debugger command, it opens a developer tool and allows us to observe the state of the flow. If the developer tool is not open, browser will simply ignore this command.
let a = 4+4;
debugger;
console.log(a);
Using console.log() method
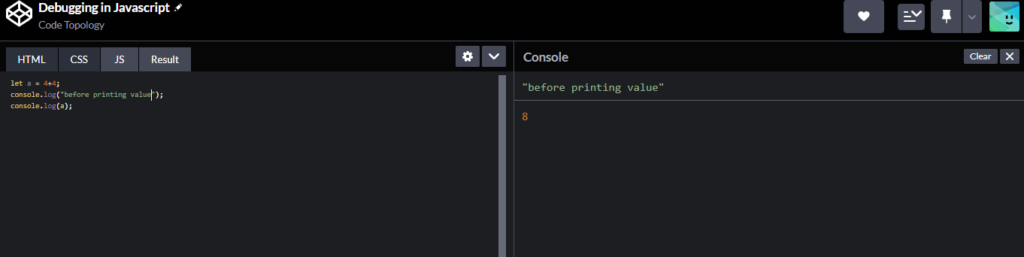
We can put our own logs in the console to debug a code in javascript. This method allows to print variables, messages, expression etc. User will not see these logs unless they have developer tool open.
let a = 4+4;
console.log("before printing value");
console.log(a);
Output of the above code will be:
Popular IDEs like Visual Studio Code, WebStorm, and Atom also offer a comprehensive debugging tools and features for JavaScript development. Choosing the right IDE with help you in debugging and solving the issue quickly.